Climate data toolkit
We provide a set of future climate files for use within your energy modeling tools. Data is available for sixteen locations representing the major North American climate zones.
Packaged, tested and free
Each package includes files for eQuest (.bin), EnergyPlus (.epw), text files (.fmt) and summary spreadsheets (.xlsx) comparing the future data to current TMY3. These files were created from NARCCAP future climate data. Specifically, we used the WRFG-CCSM global climate model data. The full global climate model data set includes a range of climate data predictions representing the years 2041 to 2070. Producing annual data files for each of these years was too computationally intensive. We therefore took the approach of selecting two years within this dataset for each of the selected cities. These years represent the years with the Lowest and Highest Annual Average Drybulb Temperature. In this way, energy modeling can be used to bracket the potential range of climate change impacts on energy performance.
Quality control
We took several steps to ensure quality weather files. Where outliers were found, we identified and corrected any issues. Our process involved:
- graphical review of annual profiles for each major climatic variable;
- graphical review of average daily profiles for drybulb temperature and total horizontal irradiance;
- quantitative review of hourly maximum, minimum and average values for each major climatic variable comparing future predictions to current values;
- running each weather file in DOE2.2 to ensure successful model runs; and
- comparing model predictions across all climates to identify trends (see Modeling Approach section for more information).
Caveats:
- The WRFG-CCSM is only one of 12 different global climate models from which we could have chosen. There exists additional predicted climate data that may be outside the range of this global climate model’s impacts.
- NARCCAP data is available in three hour intervals. We linearly extrapolated to one hour increments in order to produce hourly weather files.
- NARCCAP data is available on a 50 km × 50 km grid. This is relatively granular in order to select a location close to the TMY3 weather station for a given city. For coastal cities (Miami, Houston, San Francisco, Baltimore, Miami, Vancouver), the nearest grid point may be far enough inland as to not be as tempered by the ocean as the TMY3 weather station.
- We selected the two future years based on which had the Lowest and Highest Annual Average Drybulb Temperature. The other climate variables (wet bulb temperature, solar radiation, wind, etc.) were taken as coincident with this data. These years likely don’t include the most extreme occurrences of these other variables.
- Since these two future years were selected based on annual averages, they likely don’t include the data with the highest or lowest hourly drybulb temperature. Modeled impacts to peak cooling, peak heating or peak demand are less representative.
- When modeling in EnergyPlus, the climatic data within the .idf file may also need to be updated.
Modeling approach
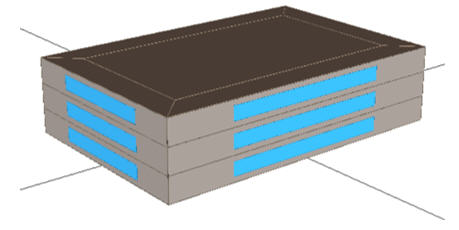
To illustrate the process of analyzing climate change impacts on building energy performance, we developed a prototype model in eQuest. The model represents a new 50,000 square foot office compliant with ASHRAE 90.1-2013 in each climate zone.

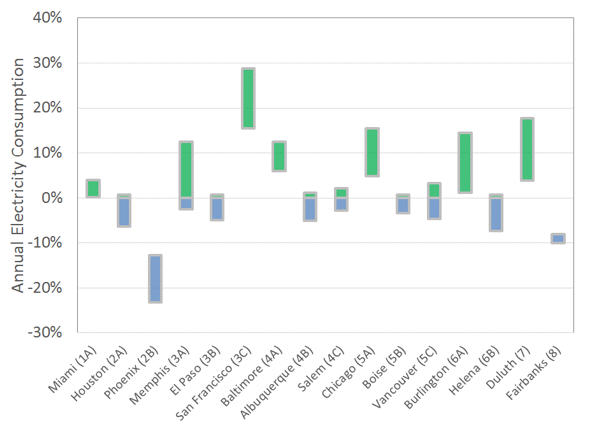
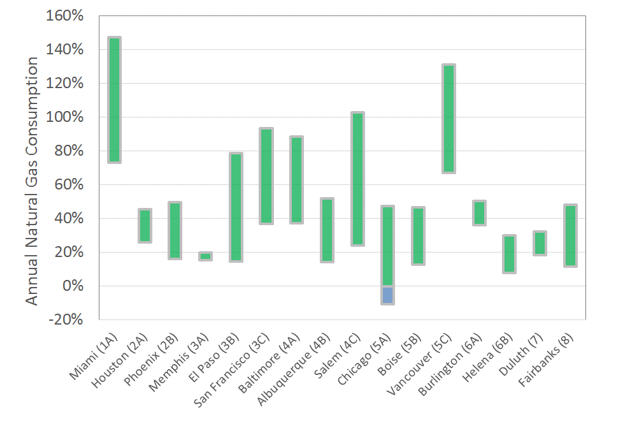
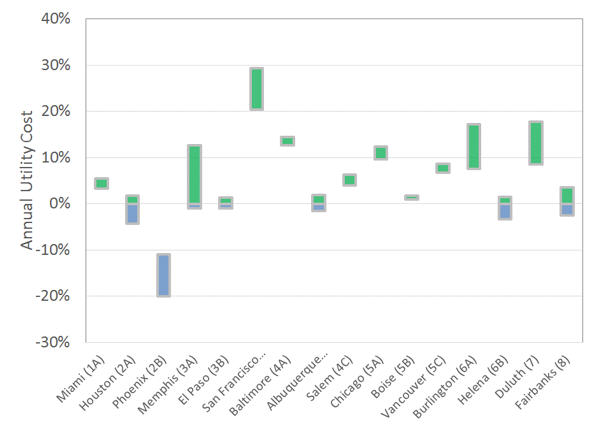
The building is served by a packaged VAV system with hot water reheat. We then ran the model using the current and both future climate files. The following figures illustrate the range of potential climate change impacts on electricity consumption, natural gas consumption and utility cost across all climate zones. Impacts are calculated as the difference between the future and current model results, meaning that positive values indicate increases (in green) as compared to current and negative values indicate decreases (in blue). The high end of each range represents the maximum impact, while the low end represents the minimum impact.

Electricity consumption is impacted by climate change as cooling equipment and fans react to varying loads. However, there was no common trend for electricity consumption impact between climate zones. Six of the climate zones (1A, 3C, 4A, 5A, 6A and 7) experienced increases, two climate zones (2B and 8) experienced decreases and the remainder showed the potential for increases or decreases. In general, increases in cooling consumption correlated with increases in cooling degree days, while decreases correlated with decreases in cooling degree days. However, in a few instances, increased electric consumption was found with decreasing cooling degree days. In this instance, the cooling degree day decrease was small, and a corresponding increase in heating degree days caused fans to work harder. On average across all climate zones, this office would experience between -2% and 7% impact on its annual electricity consumption due to climate change.

Natural gas consumption is impacted by climate change as heating equipment reacts to varying loads. Surprisingly, there was a consistent trend of increasing natural gas consumption. This trend was primarily attributable to increasing heating degree days due to more extreme winter conditions. However, increased cooling degree days also played a secondary role, increasing natural gas reheat energy. On average across all climate zones, this office would experience between 25% and 67% impact on its annual natural gas consumption due to climate change.

Annual utility cost is impacted by climate change as electricity and natural gas consumption vary. The general trend was increasing utility cost, with only climate zone 2B experiencing a decrease. On average across all climate zones, this office would experience between 3% and 8% impact on its annual utility costs due to climate change.